Page 1 of 2

Two Averages Oscillator

PostPosted: Fri Feb 24, 2012 10:57 am
by Apprentice
Two Averages Oscillator.png

This simple indicator is the result of the difference between two moving averages,
MA difference, MA Delta.
Two Averages Oscillator.lua
(6.45 KiB) Downloaded 1948 times


To work install 20 in 1 Moving Average Indicator a.k.a. Averages
viewtopic.php?f=17&t=2430

Difference between two different indicators.png

Select 1. Indicator
Select 2. Indicator
Calculate difference between two.
Both are using chart price data as a source.
Difference between two different indicators.lua
(4.36 KiB) Downloaded 1168 times


Difference between two indicators of two indicators.png


Select Indicator 1. Source Indicator
Select Indicator 2. Source Indicator
Both are using chart price data as a source.

Select Indicator 3
Select Indicator 4
Indicator 3 is using Indicator 1. as source.
Indicator 4 is using Indicator 2. as source.
Calculate difference between two.
Both are using chart price data as a source.

The indicator was revised and updated
Re: Two Averages Oscillator

PostPosted: Wed Mar 07, 2012 1:32 pm
by zmender
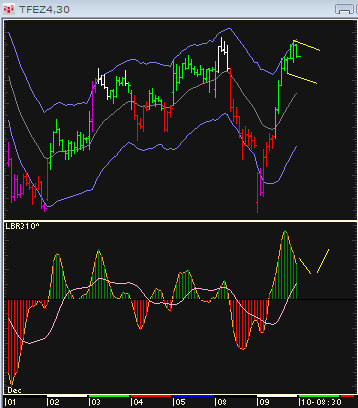
Added the functionality of plotting the differences between 2 MVAs, and a moving average of itself... based on the 3/10 oscillator by LBR.

The 3/10 OSCILLATOR

The “3/10 oscillator” is created by subtracting a 10-period simple moving average from a
3-period simple moving average, and then creating a 16-period simple moving average of
the 3/10 oscillator. These two lines are useful in confirming wave structure or highlighting
chart formations. We call the 3/10 line as the “fast” line, and the 16-period SMA the “slow”
line or trend line.

THE PRICE PULSE – THE MAIN PRINCIPLE BEHIND THE 3/10 OSCILLATOR
The 3/10 is a relatively sensitive oscillator and often highlights the “pulse” in the market’s
action. Tony Plummer best describes this “pulse” in his book, “Forecasting Financial
Markets”. It describes a “negative feedback” conditions that is present in the market about
80% of the time.

3_10.lua
(8.67 KiB) Downloaded 1483 times

Re: Two Averages Oscillator

PostPosted: Thu Feb 28, 2013 1:44 pm
by speakinmymind
Hey thanks for this Oscillator, its very powerful. Can you add a fib time zone Indicator to it? I think it has the potential to help identify entry/exit zones.

If you are Long your first time zone’s color is orange, and is set from “two averages oscillator’s” previous peak to the next bottom. The second time zone is white and is set from “two averages oscillator’s” previous bottom to the next peak. Use time zone lines 2, 3, 5, 8 only. If you are short, the white time zone set is first (short/long parameter can be set using simple moving average option):
If
• White 3 is before Orange 2:
o Signal Long Entry Opportunity Range from White 3 to Orange 2
o Signal Optimal Close Range:
 If
• Orange 5 is further than White 8 then the range is from White 8 to Orange 5
• Orange 5 is not further than White 8 then the range is from White 5 to Orange 5
o Disregard Orange 8

If
• Orange 3 is before White 2:
o Signal Short Entry Opportunity Range from Orange 3 to Orange 2
o Signal Optimal Close Range
 If
• White 5 is further than Orange 8 then the range is from Orange 8 to White 5
• White 5 is not further than Orange 8 then the range is from Orange 5 to White 5
o Disregard White 8

Re: Two Averages Oscillator

PostPosted: Fri Mar 01, 2013 5:44 am
by Apprentice
Your request is added to the developmental list.

Re: Two Averages Oscillator

PostPosted: Fri Mar 01, 2013 11:07 am
by speakinmymind
Thanks, there was a slight typo in my explanation:

"If
• Orange 3 is before White 2:
o Signal Short Entry Opportunity Range from Orange 3 to WHITE 2
o Signal Optimal Close Range
 If
• White 5 is further than Orange 8 then the range is from Orange 8 to White 5
• White 5 is not further than Orange 8 then the range is from Orange 5 to White 5
o Disregard White 8"


Also, photo 2 is inconsistent and should be ignored.

Thanks again.

Re: Two Averages Oscillator

PostPosted: Mon May 06, 2013 4:22 pm
by Jeffreyvnlk
zmender wrote:Added the functionality of plotting the differences between 2 MVAs, and a moving average of itself... based on the 3/10 oscillator by LBR.

The 3/10 OSCILLATOR

The “3/10 oscillator” is created by subtracting a 10-period simple moving average from a
3-period simple moving average, and then creating a 16-period simple moving average of
the 3/10 oscillator. These two lines are useful in confirming wave structure or highlighting
chart formations. We call the 3/10 line as the “fast” line, and the 16-period SMA the “slow”
line or trend line.

THE PRICE PULSE – THE MAIN PRINCIPLE BEHIND THE 3/10 OSCILLATOR
The 3/10 is a relatively sensitive oscillator and often highlights the “pulse” in the market’s
action. Tony Plummer best describes this “pulse” in his book, “Forecasting Financial
Markets”. It describes a “negative feedback” conditions that is present in the market about
80% of the time.


When I saw Linda trading , i wondered where can i get "3/10 MA oscillator" version for FXCM's TS and i thought i could not find anywhere even in fxcodebase. Amazing.Thanks

Re: Two Averages Oscillator

PostPosted: Thu May 09, 2013 4:27 am
by gianpierobn
would be possible plot this indicator as line on the chart?

And woud be possibile create a second indicators as diference between Tow average oscillator?
like this Two av. osc. (period t ) - Tow Av. Osc. ( t-1)?We could have two indicators on the chart, Two average oscilator and its velocity....
Thanks

Re: Two Averages Oscillator

PostPosted: Sat May 11, 2013 2:22 am
by Apprentice
Your request is added to the development list.

Re: Two Averages Oscillator

PostPosted: Mon Sep 15, 2014 12:14 pm
by Alexander.Gettinger
MQL4 version of Two Averages Oscillator: viewtopic.php?f=38&t=61150.

Re: Two Averages Oscillator

PostPosted: Wed Dec 10, 2014 3:47 am
by Jeffreyvnlk
Can you customize 3/10 Linda oscillator like this ? This taken from Linda website

Image