The rules are the following:
Apprentice wrote:Gann Swing indicators
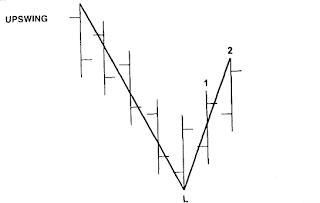
1.Two consecutive Higher High candles indicate Upswing.
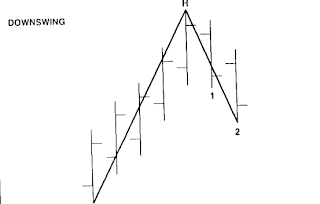
2.Two consecutive Lower Low candles indicate Downswing.
3.Swing lines connect either Highs or Lows of individual bars - never Open or Close.
4.If the next bar has a higher high and a higher low (or the same low) when compared to the previous bar, then the swing line goes up connecting the high of the next bar.
5. If the next bar has a lower high (or same high) and a lower low when compared to the previous bar, then the swing line goes down connecting the low of the next bar.
6.If the next bar is an inside bar (lower high and higher low), ignore it and don’t plot a line on it at all – wait for the next bar.
7.If the next br is an outside bar (higher high and lower low), plot a swing line on the high of an outside bar if the following bar (one after the outside bar) is lower, OR plot a swing line on the low of an outside bar if the following bar (one after the outside bar) is higher.
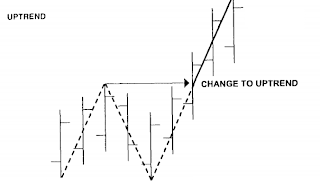
8. Market growth over the previous peak marks the beginning of Uptrenda (Solid line).
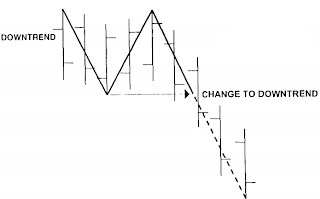
9. Markets fall below the previous valley marks the beginning of Downtrenda (Dash line).
- Code: Select all
-- initializes the indicator
function Init()
    indicator:name("Gann Swing");
    indicator:description("");
    indicator:requiredSource(core.Bar);
    indicator:type(core.Indicator);

    indicator.parameters:addColor("clr", "Color of the line", "", core.rgb(255, 0, 0));
end

local first = 0;
local source = nil;
local high = nil;
local low = nil;
local out = nil;

-- initializes the instance of the indicator
function Prepare()
    source = instance.source;
    high = source.high;
    low = source.low;
    first = source:first();
    local name = profile:id() .. "(" .. source:name() .. ")";
    instance:name(name);
    out = instance:addStream("GSW", core.Line, name, "GSW", instance.parameters.clr,  first);
end

local swingNone = 0;
local swingUp = 1;
local swingDown = -1;
local swingDir = nil;
local _previousPeak = nil;
local _previousDrawn = nil;

-- calculate the value
function Update(period)
    local i, us, ds;

    if (period <= 3) then
        swingDir = swingNone;
        _previousPeak = nil;
        _previousDrawn = nil;
    end

    local previousPeak = nil;
    local previousDrawn = nil;

    if _previousPeak ~= nil then
        for i = period, 0, -1 do
            if (source:date(i) == _previousDrawn) then
                previousDrawn = i;
            end
            if (source:date(i) == _previousPeak) then
                previousPeak = i;
                break;
            end
        end
    end

    if (previousPeak == nil) then
        swingDir = swingNone;
        previousDrawn = nil;
    end

    period = period - 1;        -- calculate for the previous period
    if previousPeak ~= nil and previousPeak == period then
        return ;
    end

    if (period > 3) then
        -- check for swing high and swing low conditions
        us = false;
        ds = false;

        -- 1.Two consecutive Higher High candles indicate Upswing.
        if high[period] > high[period - 1] and high[period - 1] > high[period - 2] then
            us = true;
        end

        -- 2.Two consecutive Lower Low candles indicate Downswing.
        if low[period] < low[period - 1] and low[period - 1] < low[period - 2] then
            ds = true;
        end

        -- 4.If the next bar has a higher high and a higher low (or the same low) when
        -- compared to the previous bar, then the swing line goes up connecting the high of the next bar.
        if not(us) and high[period] > high[period - 1] and low[period] >= low[period -1] then
            us = true;
        end

        -- 5. If the next bar has a lower high (or same high) and a
        -- lower low when compared to the previous bar, then the swing line goes down connecting the low of the next bar.
        if not(ds) and high[period] <= high[period - 1] and low[period] < low[period -1] then
            ds = true;
        end

        if us then
            if swingDir == swingUp then
                core.drawLine(out, core.range(previousPeak, period), out[previousPeak], previousPeak, high[period], period);
                previousDrawn = period;
            elseif swingDir == swingDown then
                -- direction was changed
                core.drawLine(out, core.range(previousDrawn, period), out[previousDrawn], previousDrawn, high[period], period);
                swingDir = swingUp;
                previousPeak = previousDrawn;
                previousDrawn = period;
            else
                -- no direction yet
                swingDir = swingUp;
                previousPeak = period;
                previousDrawn = period;
                out[period] = high[period];
            end
        elseif ds then
            if swingDir == swingDown then
                -- continue the gann line from the last peak
                core.drawLine(out, core.range(previousPeak, period), out[previousPeak], previousPeak, low[period], period);
                previousDrawn = period;
            elseif swingDir == swingUp then
                -- direction was changed
                core.drawLine(out, core.range(previousDrawn, period), out[previousDrawn], previousDrawn, low[period], period);
                swingDir = swingDown;
                previousPeak = previousDrawn;
                previousDrawn = period;
            else
                -- no direction yet
                swingDir = swingDown;
                previousPeak = period;
                previousDrawn = period;
                out[period] = low[period];
            end
        else
            -- 7.If the next br is an outside bar (higher high and
            -- lower low), plot a swing line on the high of an outside bar if the
            -- following bar (one after the outside bar) is lower, OR plot a swing
            -- line on the low of an outside bar if the following bar (one after the
            -- outside bar) is higher.
            if (high[period - 1] > high[period - 2] and low[period - 1] < low[period - 2]) then
                -- outside bar was before the current bar
                if (high[period] > high[period - 1] and low[period] >= low[period - 1]) then
                    -- plot to low
                    if swingDir == swingDown then
                        -- continue the gann line from the last peak
                        core.drawLine(out, core.range(previousPeak, period), out[previousPeak], previousPeak, low[period], period);
                        previousDrawn = period;
                    elseif swingDir == swingUp then
                        -- direction was changed
                        core.drawLine(out, core.range(previousDrawn, period), out[previousDrawn], previousDrawn, low[period], period);
                        swingDir = swingDown;
                        previousPeak = previousDrawn;
                        previousDrawn = period;
                    end
                elseif (high[period] <= high[period - 1] and low[period] < low[period - 1]) then
                    -- plot to high
                    if swingDir == swingUp then
                        core.drawLine(out, core.range(previousPeak, period), out[previousPeak], previousPeak, high[period], period);
                        previousDrawn = period;
                    elseif swingDir == swingDown then
                        -- direction was changed
                        core.drawLine(out, core.range(previousDrawn, period), out[previousDrawn], previousDrawn, high[period], period);
                        swingDir = swingUp;
                        previousPeak = previousDrawn;
                        previousDrawn = period;
                    end
                end
            end
        end
        if (previousPeak ~= nil) then
            _previousPeak = source:date(previousPeak);
        end
        if (previousDrawn ~= nil) then
            _previousDrawn = source:date(previousDrawn);
        end
    end
end
Download:
 gannswing.lua
- (7.25 KiB) Downloaded 2581 times
Many thanks to user Apprentice who prepared the excellent specification and walked an extra mile with us in testing of this indicator.
Mq4 version can be found here.
viewtopic.php?f=38&t=63884&p=108195#p108195
The indicator was revised and updated
