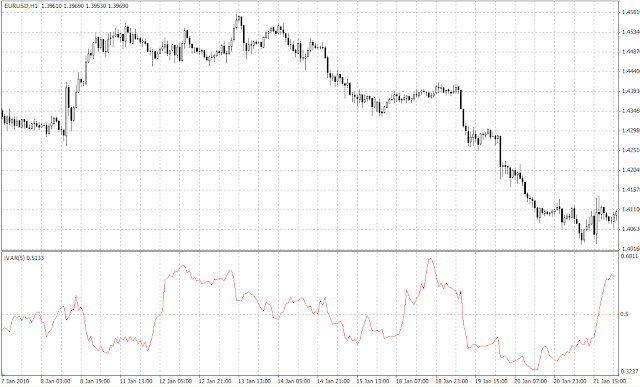
You are the best, I have a new task for you, Variation Index,
shows the existence or absence of trend.
Variation Index < 0.5 - Trending Market
Variation Index > 0.5 - Flat Market
The common rules of the indicator application are the following:
* If the value of the indicator is lower than 0.5 it means the trend state of the market.
* The extremely low value is often precedes the end (correction) of the current trend.
* If the value of the indicator is higher than 0.5 it means the flat state of the market.
* The extremely high value is often precedes the beginning of the considerable trends.
* If the value of the indicator is close to 0.5 it means an undefined state of the market.
- Code: Select all
//+------------------------------------------------------------------+
//|                                                         iVAR.mq4 |
//|                                        (C)opyright © 2008, Ilnur |
//|                                        http://www.metaquotes.net |
//+------------------------------------------------------------------+

//The indicator displays a variation index of the price series,
//calculated on a previous interval which is 2^n long. The variation index
//shows what dominates in a time series - the trend or the flat component
//or the series acts randomly.

// M.M.Dubovikov, A.V.Kryanev, N.V.Starchenko
// Dimension of the Minimal Cover and Local Analysis of Fractal Time Series.

#property copyright "(C)opyright © 2008, Ilnur"
#property link      "http://www.metaquotes.net"
//---- indicator options
#property indicator_separate_window
#property indicator_buffers 1
#property indicator_color1 Red
#property indicator_level1 0.5
//---- input parameters
extern int n = 5;
extern int nBars = 1000;
//---- indicator buffers
double ibuffer[];

#define LOG_2_0 0.69314718055994530941723212145818 //MathLog(2.0);

//+------------------------------------------------------------------+
//| Custom indicator initialization function                         |
//+------------------------------------------------------------------+
int init()
{
//---- drawing settings
   SetIndexBuffer(0,ibuffer);
   SetIndexStyle(0,DRAW_LINE);
   SetIndexDrawBegin(0,Bars-nBars);
   SetIndexLabel(0,"iVAR");
//---- name for DataWindow and indicator subwindow label
   IndicatorShortName("iVAR("+n+")");
   return(0);
}
//+------------------------------------------------------------------+
//| Custom indicator iteration function                              |
//+------------------------------------------------------------------+
int start()
{
   int i, j, k, kCount, nTotal, nCountedBars = IndicatorCounted();
   int ihigh, ilow, nInterval, nIntervalStart;
   double Delta, Xc, Yc, Sx, Sy, Sxx, Sxy;
//---- last counted bar will be recounted
   if(nCountedBars==0) nTotal = nBars;
   if(nCountedBars>0) nTotal = Bars-nCountedBars-1;
//---- main loop
   for(j=nTotal; j>=0; j--)
   {
      Sx = 0; Sy = 0; Sxx = 0; Sxy = 0;
      for(i=0; i<=n; i++)
      {
         nInterval = 1 << (n-i); //MathPow(2,n-i);
         kCount = 1 << i; //MathPow(2,i);
      //---- summarise differences of the maximum and minimum prices on an interval
         for(Delta=0, k=0; k<kCount; k++)
         {
            nIntervalStart = nInterval*k+j;
            ihigh = iHighest(Symbol(),0,MODE_HIGH,nInterval,nIntervalStart);
            ilow = iLowest(Symbol(),0,MODE_LOW,nInterval,nIntervalStart);
            Delta += High[ihigh]-Low[ilow];
         }
      //---- compute coordinate of variation [Xc,Yc] in double logarithmic scale
         Xc = (n-i)*LOG_2_0; //MathLog(2.0);
         Yc = MathLog(Delta);
      //---- accumulate data for finding of factors of line of regress by means of LMS (least mean squares)
         Sx += Xc;
         Sy += Yc;
         Sxx += Xc*Xc;
         Sxy += Xc*Yc;
      }
   //---- compute variation index (slope of the line of regress)
      ibuffer[j] = -(Sx*Sy-(n+1)*Sxy)/(Sx*Sx-(n+1)*Sxx);
   }
   return(0);
}
P.S. I hope that the new version of Marketscope be able to call, data for multiple currency pairs.
Apprentice
